Previous
The discriminatory power of mean()
19 June 2020 on posts
Dear anyone that works with data,
The recent demand for racial justice in the USA has demonstrated that society does not value everyone equally. This is not a new insight, yet it remains a pervasive issue. With this in mind, I argue that we, as scientists, need to carefully consider the potentially discriminatory effect of a seemingly innocuous mathematical operation.
The discriminatory power of mean()
In statistics, discriminatory power refers to the ability to differentiate significantly between different classes or responses. In everyday usage, the term discriminatory refers to an unfair or prejudicial distinction between different categories of people or things.
The mean() operation is unquestionably useful and relevant to all fields of science.
As a summary statistic, it efficiently collapses variability into a single indicator.
This is particularly important when variability is considered “noise”.
But in many societally-relevant contexts, variability is not “noise”. Variability represents people’s lives. In particular, people (as well as other living and non-living things) at the tail end of the distribution – the “noisiest” data points – are often the most vulnerable.
Thus, by averaging data or results, we discriminate.
mean() is a discriminatory operation.
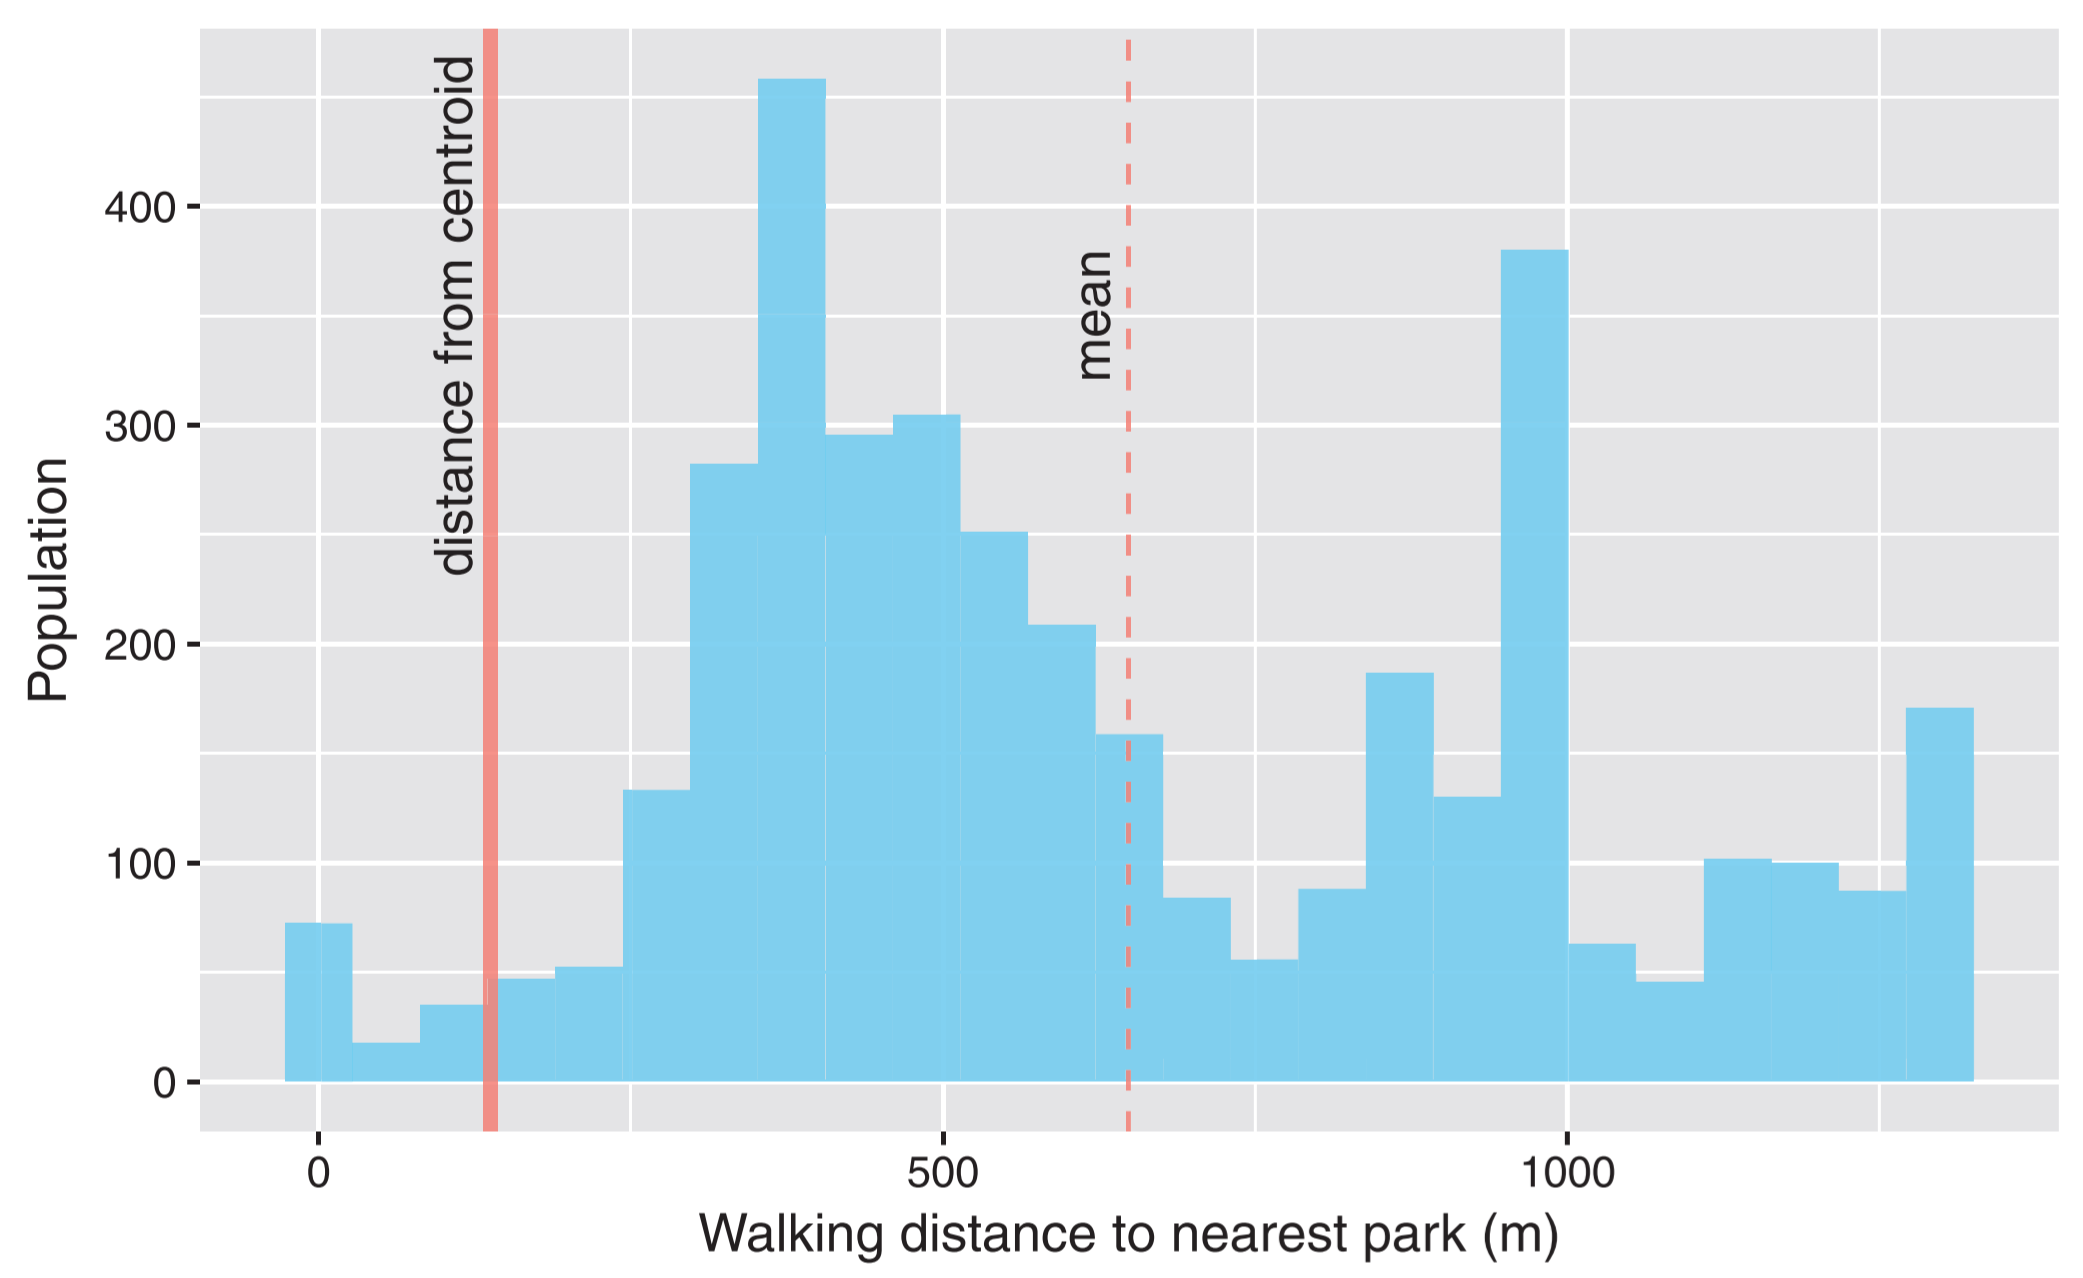
For example, the below figure is taken from a study authored by Tom Logan and me.
It shows the distribution of how far people live from parks within a census block in the USA.
The dashed vertical line represents the mean of this distribution.
If we were to use solely the mean() value to represent these data, we ignore the “noise,” therefore ignoring those people who live almost 1.5km away from a park.
These are the people who stand to benefit the most from proactive urban planning.
Their lack of access indeed contributes to the mean, yet it is equally counteracted by people who live closer to parks.
The discriminatory power of mean() is not restricted to urban contexts within the USA.
In a paper I recently published, I focused on smallholder farmers in Ethiopia and found that strategies that enhance climate resilience on average can lead to inequitable effects – i.e., they disproportionately benefit the less vulnerable households.
If I had taken the mean() of the results (admittedly, as I originally did), this important and potentially discriminatory effect would have been missed.
The “mean() value judgement”
When you average, you make an implicit value judgement – the “mean value judgement” – that the tails of a distribution are not critically important. Given that this is a Risk Science blog, this is especially pertinent. This is what risk is. It’s about things that are not average. Things that are not expected.
We cannot design our societies for the average. People, and the contexts in which they live, are beautifully diverse. The “mean value judgement” ignores this diversity. We should acknowledge and embrace this diversity as we plan for the future.
There are many approaches from many scientific disciplines that can be used to explore distributional effects. I am not going to detail them in this post.
I simply urge you, next time you find yourself typing mean() into your code, to please stop to think about what it means.
Particularly for those without means.
Sincerely,
Tim
PS: if you still work in Microsoft Excel, I firstly suggest that you learn to code. Otherwise, please replace mean() with AVERAGE() throughout this letter :)